AWS Monitoring Services in a Nutshell
1. The Nutshell View
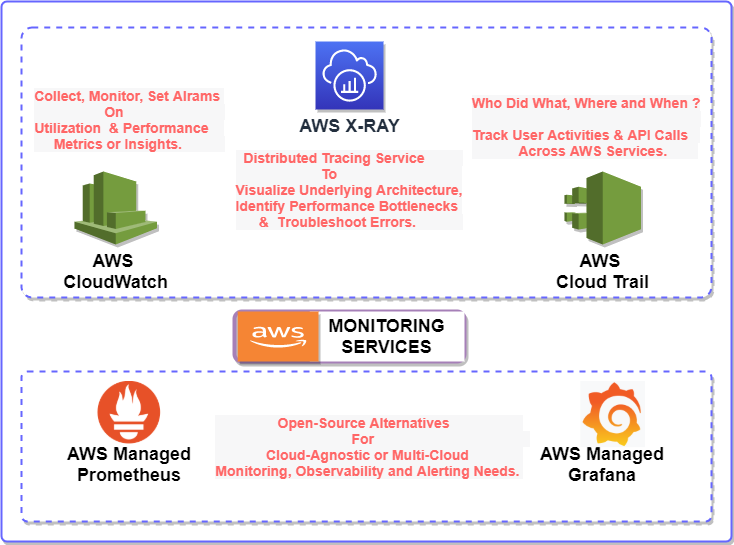
AWS Monitoring Services covers the collection of the monitoring services that provide comprehensive insights into our applications, infrastructure, and user activities, enabling efficient troubleshooting, performance optimization, and resource management.
As shown in the cheatsheet diagram above, the AWS X-Ray is a distributed tracing service which enables us to visually comprehend the call flows, application dependencies, response times and easily debug the performance issues.
The AWS CloudWatch is an easily configurable, feature rich monitoring and alerting service to collect the performance metrices from various AWS resources, generate actionable events and provide deeper insights into our runtime environments.
While Amazon CloudWatch is powerful and tightly integrated with AWS services, it primarily caters to AWS-specific environments. The managed Prometheus and Grafana service are alternative choices, especially when you require cloud-agnostic or multi-cloud monitoring, observability, and alerting solutions.
The table below provides a brief summary of the key features for each these services.
2. Brief Descriptions, Features & Usages of the Monitoring Services
2.1 Monitoring & Performance Analytics Services
| AWS Service | Objective | Sample Usages |
|---|---|---|
| AWS X-Ray | Advanced distributed tracing and trace analytics service. It provides a visual representation of your application’s architecture, allowing you to identify performance bottlenecks and troubleshoot errors. X-Ray traces requests across services and provides detailed information about latencies and dependencies. | Distributed Tracing: X-Ray provides end-to-end tracing of requests across all the microservices and components which enables developers to identify bottlenecks and troubleshoot performance issues. Service Map: X-Ray generates an interactive service map that visually represents the components of your application and their interactions. Performance Insights: X-Ray provides detailed insights into the performance of your application, including response times, error rates, and other relevant metrics. Trace Analytics: X-Ray includes trace analytics, allowing you to search, filter, and analyze traces to gain deeper insights into specific requests and user interactions. Integration with AWS Services: X-Ray seamlessly integrates with various AWS services and SDKs, allowing automatic tracing of requests in AWS Lambda, API Gateway, ECS, EC2, and more. |
| Amazon CloudWatch | Amazon CloudWatch includes a wide range of monitoring and management service that provides data and actionable insights for AWS, on-premises, hybrid, and other cloud applications and infrastructure resources. CloudWatch enables you to monitor your complete stack (applications, infrastructure, network, and services) and use alarms, logs, and events data to take automated actions and reduce mean time to resolution (MTTR). | 1. Real-time Monitoring: Monitor the health of EC2 instances, RDS databases, and other resources in real-time. 2. Auto Scaling: Use CloudWatch alarms to trigger Auto Scaling actions based on specific metrics like CPU utilization. |
| AWS Managed Prometheus | Managed Prometheus service offered by AWS. Prometheus is an open-source monitoring and alerting toolkit designed for reliability and scalability. Managed Services for Prometheus automates the provisioning, scaling, and maintenance of Prometheus servers. It enables users to monitor applications and infrastructure using Prometheus-compatible APIs and integrates with AWS services like Amazon CloudWatch. | Cloud Agnostic: Managed Prometheus services are not tied to a specific cloud provider, making them suitable for multi-cloud or hybrid cloud environments. Flexibility: Prometheus supports various integrations and data sources. Scalability: Managed Prometheus services can scale horizontally and handle large-scale monitoring needs, making them suitable for complex multi-cloud architectures. PromQL Queries: Prometheus Query Language (PromQL) allows sophisticated querying, enabling in-depth analysis of metrics from multiple cloud providers. |
| AWS Managed Grafana | Managed Grafana service offered by AWS. Managed Grafana is a fully managed and scalable Grafana service provided by AWS. Grafana is an open-source platform for monitoring and observability that integrates with various data sources. Managed Grafana simplifies the deployment, scaling, and maintenance of Grafana, allowing users to create dashboards and visualizations for their metrics and logs data. | Data Source Integration: Grafana can connect to various data sources, including Prometheus, allowing you to create unified dashboards for metrics and logs from different cloud providers or on-premises environments. Multi-Cloud Data Visualization & Alerting: Grafana provides alerting capabilities, allowing you to set up unified alerts based on data from diverse sources, ensuring a consistent alerting mechanism across clouds. |
2.2 Audit Trail or Monitoring of Account Activities
| AWS Service | Objective | Sample Usages |
|---|---|---|
| AWS CloudTrail | CloudTrail : "Who did what, where, and when?" AWS CloudTrail enables auditing, security monitoring, and operational troubleshooting. CloudTrail records user activity and API calls across AWS services as events. | Comprehensive Activity Logging: It records all API requests and actions made within your AWS account, providing a detailed history of account activity. This is very useful in enhancing security and compliance monitoring. Log File Integrity and Security: CloudTrail logs are stored in a secure S3 bucket, and each log file is cryptographically signed, making them tamper-evident. This ensures the integrity and authenticity of log data. Configurable Event Logging and Alerting: Offers flexibility to log only the events relevant to your specific use case, while also enabling you to set up alerts and notifications for specific events, enhancing security and compliance management. Integration with AWS Services: CloudTrail integrates with other AWS services, including CloudWatch, SNS, and AWS Config, for real-time monitoring, automated responses, and enhanced visibility. |
2.3 Key Components of Amazon CloudWatch
Amazon CloudWatch is a comprehensive monitoring service from AWS, offering several key modules and components to provide detailed insights and observability into your AWS resources and applications.
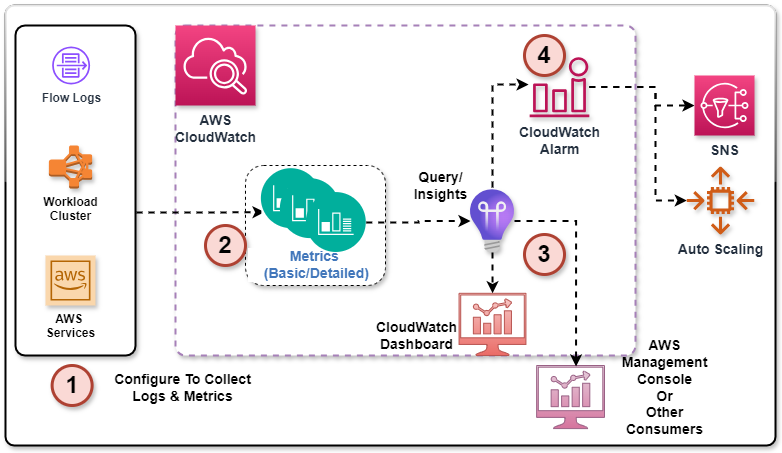
Metrics, Alarms & Dashboards
- CloudWatch Metrics: Metrics are fundamental data points representing different aspects of your AWS resources.
CloudWatch collects and monitors metrics from various AWS services, allowing you to track performance, resource
utilization, and operational health.
- CloudWatch Alarms: Alarms allow you to set thresholds on metrics and trigger actions or notifications when
those thresholds are breached. You can set up alarms to automate responses to specific conditions, ensuring timely
remediation of issues.
- CloudWatch Events: It enables you to automate your workflows by responding to changes in your AWS resources
or application metrics. Events can trigger actions in various AWS services, including invoking AWS Lambda functions
or sending notifications via SNS.
- CloudWatch Dashboards: Dashboards provide
customizable, visual representations of your metrics and alarms. You can create dashboards to monitor specific resources, applications, or custom views, allowing you to gain quick insights into your environment.
Application Monitoring
- CloudWatch Synthetics: This feature allows you to create canaries, which are configurable scripts that
mimic user behavior to test and ensure the health of your endpoints and APIs at regular intervals.
Insights and operational visibility
- CloudWatch Logs: CloudWatch Logs enables you to
collect, monitor, and store log datafrom your applications and resources. It supports real-time log streaming and advanced querying capabilities using CloudWatch Logs Insights. - CloudWatch Log Insights: CloudWatch Logs Insights is a tool for searching and analyzing log data interactively.
It allows you to write complex queries and
quickly identify patterns, anomalies, and trendswithin your log data. - CloudWatch Container Insights: Provides detailed
monitoring and performance metrics for containerized applications. It integrates with Amazon ECS, EKS and Fargate workloads offering insights into resource utilization, application performance, and operational health. - CloudWatch Anomaly Detection: When you enable anomaly detection for a metric, CloudWatch applies
ML algorithms to the metric's past data to create a model of the metric's expected values. The model assesses hourly, daily, and weekly patterns of the metric. - CloudWatch ServiceLens: ServiceLens is a feature within CloudWatch that provides end-to-end observability for your applications. It combines logs, metrics, and traces (X-Ray) into a unified view, helping you analyze the health and performance of your microservices and distributed applications.
- CloudWatch Metric Math: CloudWatch Metric Math allows you to perform mathematical operations on multiple metrics. You can create derived metrics, calculate rates, aggregate values, and apply statistical functions to gain deeper insights into your data.